Chrome内置测速工具让我发现浏览器在拖慢每个网站
DiebugI ran Chrome’s built-in speed test and found out my own browser was adding four seconds to every site I visited
来源: makeuseof | 原文链接: https://www.makeuseof.com/run-lighthouse-speed-test-google-chrome/

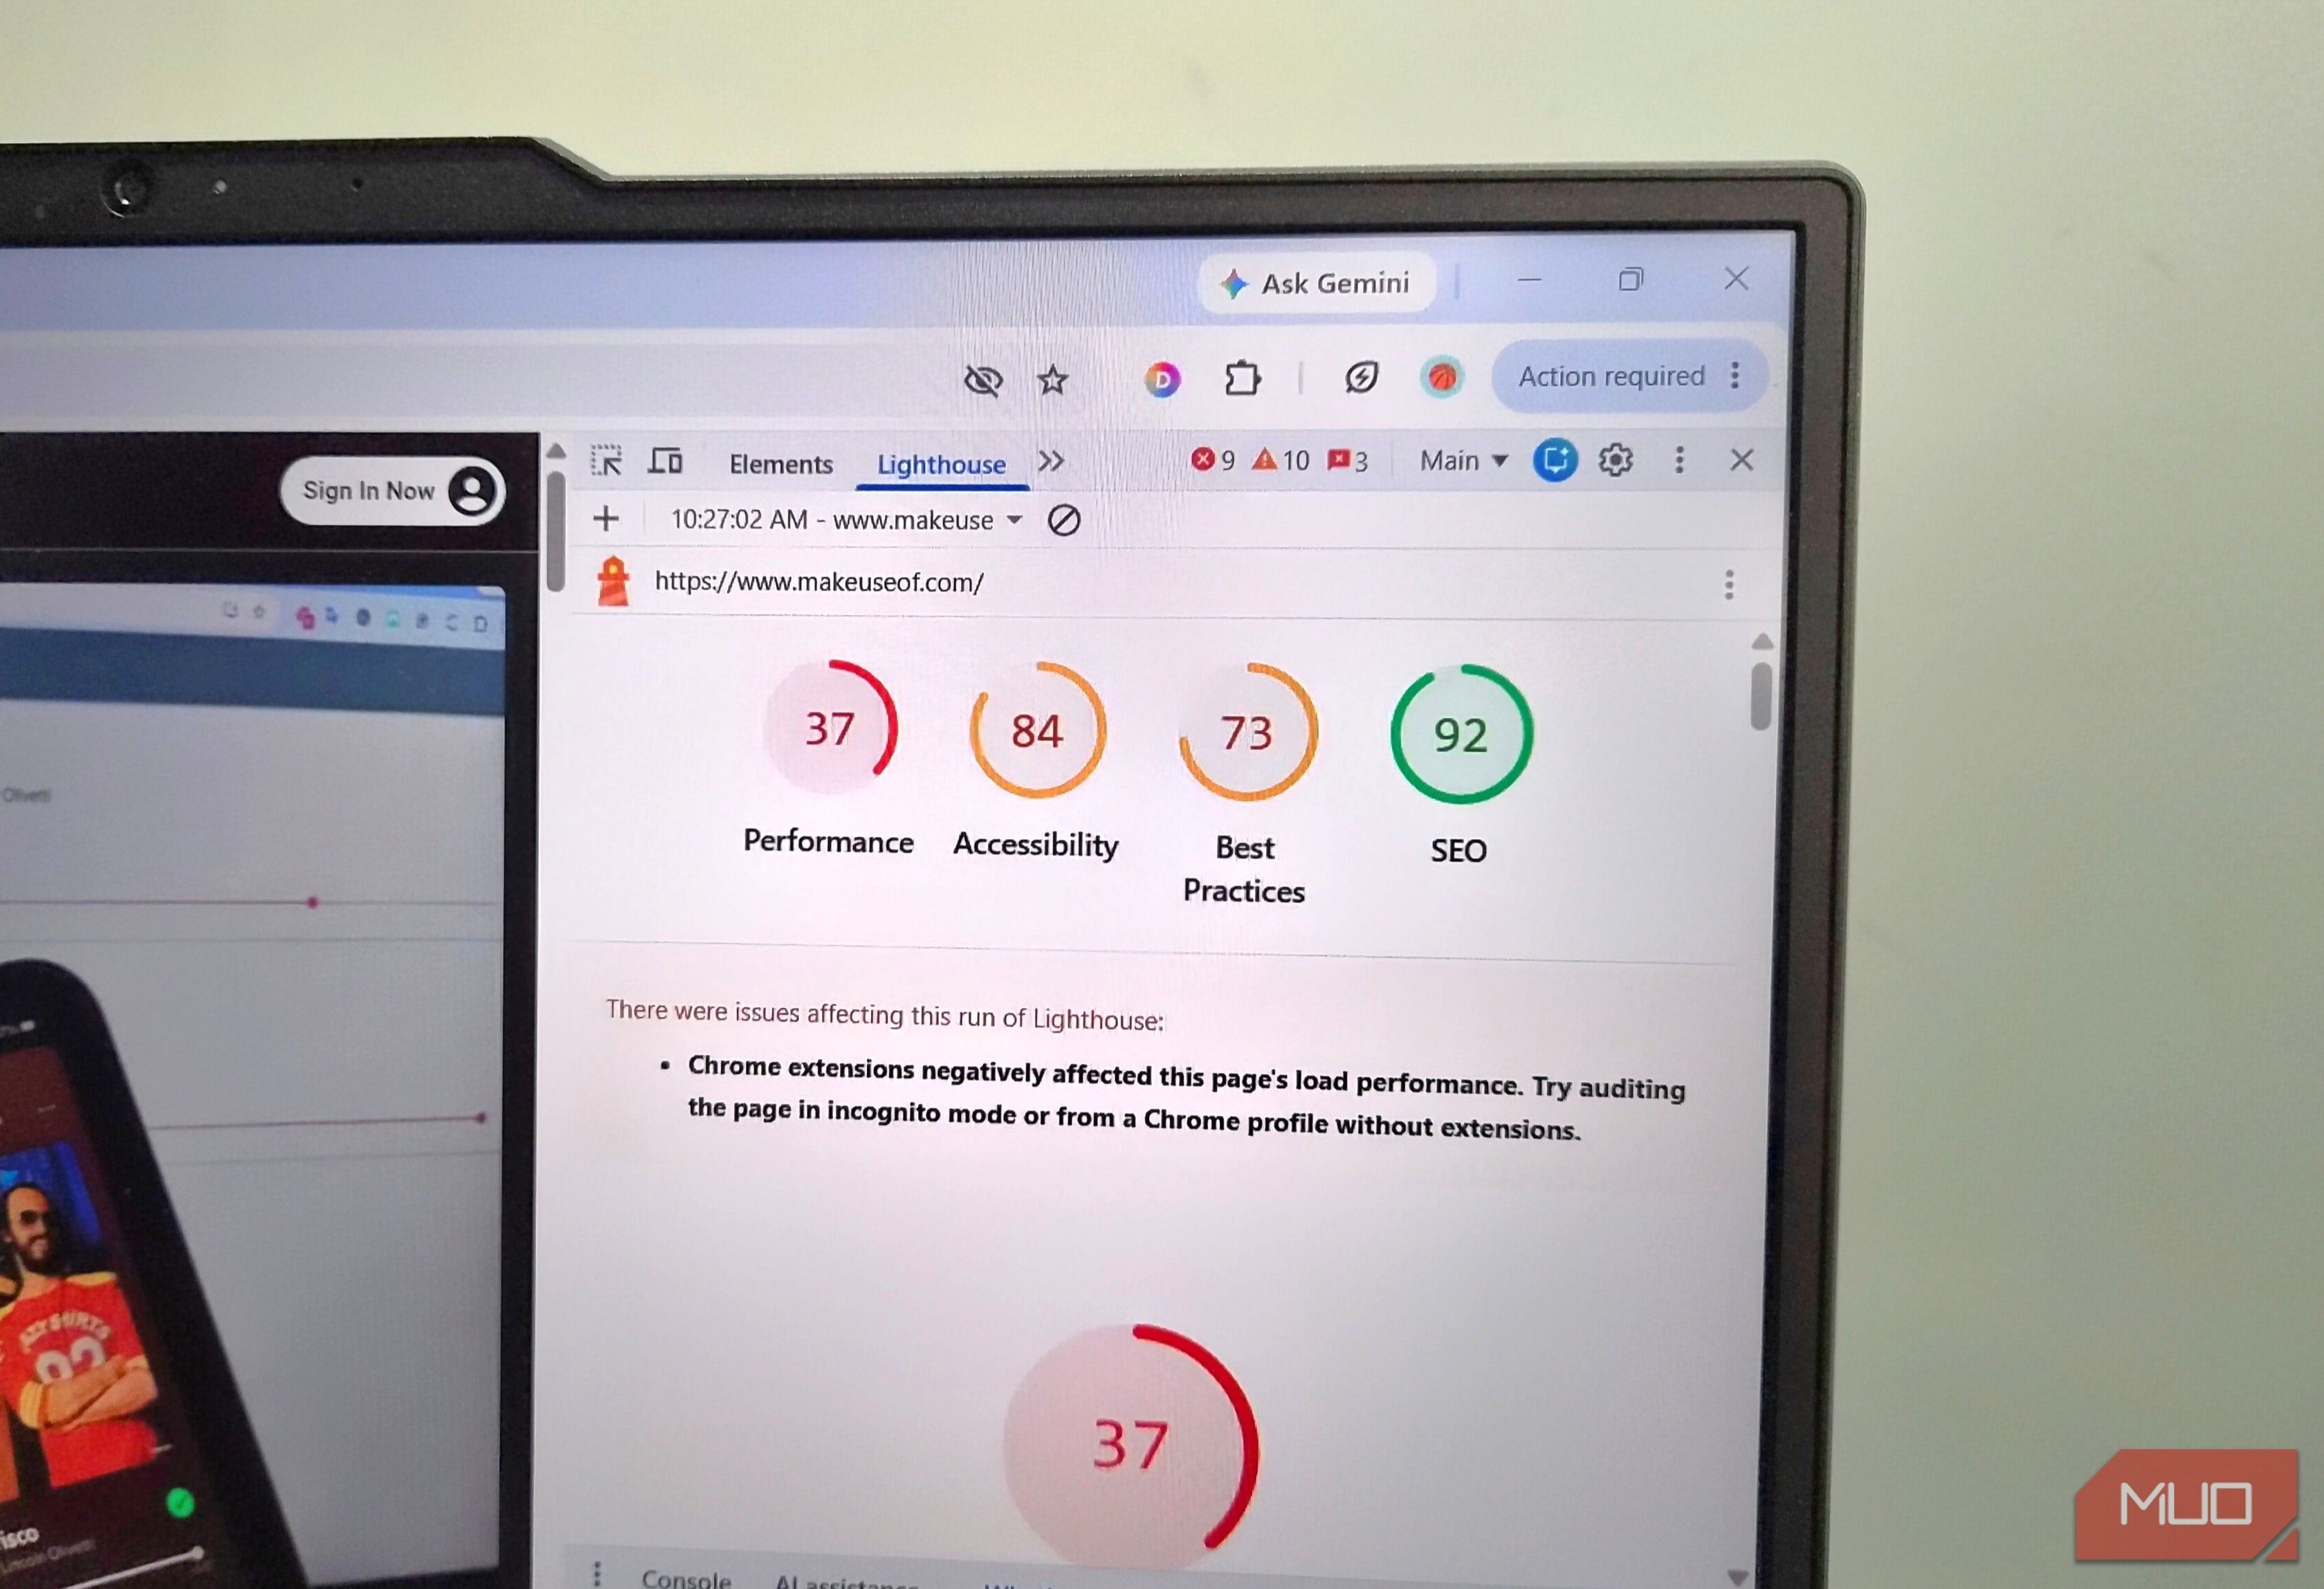
I ran Chrome’s built-in speed test and found out my own browser was adding four seconds to every site I visited Pankil Shah / MakeUseOf Credit: Pankil Shah / MakeUseOf By Pankil Shah Published Aug 5, 2026, 9:00 AM EDT Pankil is a Civil Engineer turned freelance writer from Ahmedabad, India. As a long-time Windows and Android user, he has extensive knowledge of both operating systems and specializes in creating how-tos and troubleshooting guides. Pankil has been writing about Windows, Android, and iOS since 2021. He has written over 1200 articles across reputable publications like MakeUseOf, GuidingTech, and TechWiser. Outside of his writing endeavors, Pankil is an avid football fan and loves to plan his international travels with his wife in his free time. Sign in to your MakeUseOf account Add Us Add on Google Preferred Source Google News Like Like follow Follow followed Followed Thread Log in Here is a fact-based summary of the story contents: Try something different: Show me the facts Explain it like I’m 5 Give me a lighthearted recap Any time sites take longer than usual to load, the blame usually goes to one of two places — your internet connection or the site itself. Sometimes, though, it’s neither of those two things, but the browser itself that causes the slowdown. Honestly, I wouldn’t have believed this if you told me last week, but Chrome’s built-in speed test tool proved me wrong. It exposed exactly what was adding four seconds to every site I visited — and it had nothing to do with my Wi-Fi. Related You’re barely using half of what Chrome on Android can do It’s time to make the most of what Chrome offers. Posts 3 By Pankil Shah ## Chrome has a built-in tool that explains slow websites ### It’s not just for developers Pankil Shah / MakeUseOf Credit: Pankil Shah / MakeUseOf Chrome’s Developer Tools menu is something you only open by accident. It’s overwhelming and mostly for developers for testing and editing code. But among those developer tools, there’s something called Lighthouse that can be particularly useful to you. It’s Google’s open-source auditing tool that can tell you a lot about how sites are loading on your end. Yes, it’s primarily for developers, but that doesn’t mean you can’t use it for diagnosing your own browsing experience. Lighthouse can run a full diagnostic on any page you point it at. The way it works is quite simple. It loads the page, measures how long different parts of it take to appear, and spits out a performance score. More usefully, it gives you a breakdown of exactly what slowed things down. It could be render-blocking scripts, third-party trackers, and even extensions getting in the way. Of course, the issue isn’t always on your end. Sometimes the slowness comes from the site itself. It could be due to the type of ads it’s loading, analytics scripts, or those social media embeds. All of it can slow things down and leave you blaming your internet or the browser. Lighthouse even clarifies those things. Stil
翻译提示
本文已自动抓取,建议人工润色后发布。